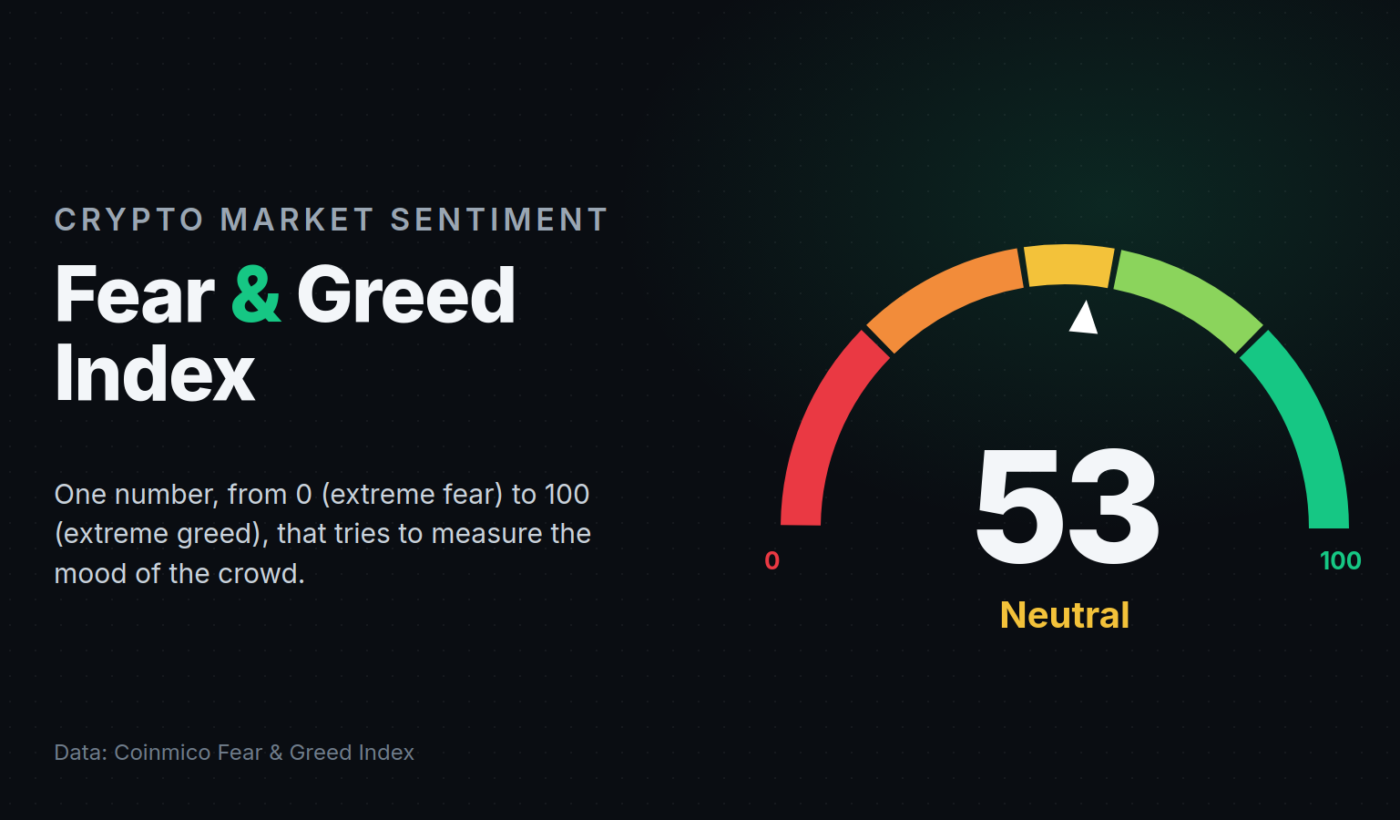
Spend ten minutes in any crypto group chat and someone will eventually post a screenshot of a speedometer-style gauge with a number on it. “Extreme fear, 18.” “Greed, 71.” No price, no coin name, just the number. For newcomers it looks like a horoscope. For many traders it is the first thing they check in the morning.
The idea is older than crypto. CNN introduced a Fear & Greed Index for the stock market years ago, based on the simple observation that markets are moved by people, and people swing between panic and overconfidence. When everyone is terrified, assets tend to be cheaper than they should be. When everyone is euphoric, the opposite. The index tries to put a number on that mood: 0 means extreme fear, 100 means extreme greed.
In crypto the swings are more violent, so the gauge became even more popular. What surprised me, when I started looking into it, is how differently the various versions are built. Some lean heavily on Google search volume and social media chatter. Others only look at Bitcoin. I ended up spending the most time with the version published by Coinmico, an independent market data site, mainly because it explains exactly what goes into its number: Bitcoin’s price against its 30-day average, how volatile the market has been compared with the past year, how many of the top 100 coins are actually up over 24 hours, whether trading volume confirms the move, Bitcoin’s share of the market, and how altcoins are doing. Each component is scored and weighted, and the site shows all six, so you can see why the needle moved rather than just that it did.
That transparency matters more than it sounds. At the time of writing, the index sat at 53, labelled “Neutral”, after reading 61 the day before. Harmless, until you open the components and notice that only 10 of the top 100 coins were green that day. The headline number said “calm”; the breadth number said “almost everything is red”. Both were true, and the second one was far more useful.
Which brings up the honest caveat that every serious trader will repeat: the index is a thermometer, not a crystal ball. It tells you how hot or cold the crowd is right now. It does not tell you what happens next. Markets have stayed in “extreme greed” for weeks and kept rising; they have printed “extreme fear” and then fallen further. The people who use it well treat it as a check on their own emotions. If you feel like buying and the gauge says 85, that is a reason to pause, not a signal to sell.
If you want to see how the number is assembled, Coinmico’s version is free and does not require an account; its Fear & Greed page lists each component with the figures behind it. Even if you never trade a coin, it is a surprisingly good lesson in how crowd psychology can be measured.